Recent searches
Search options

Administered by:


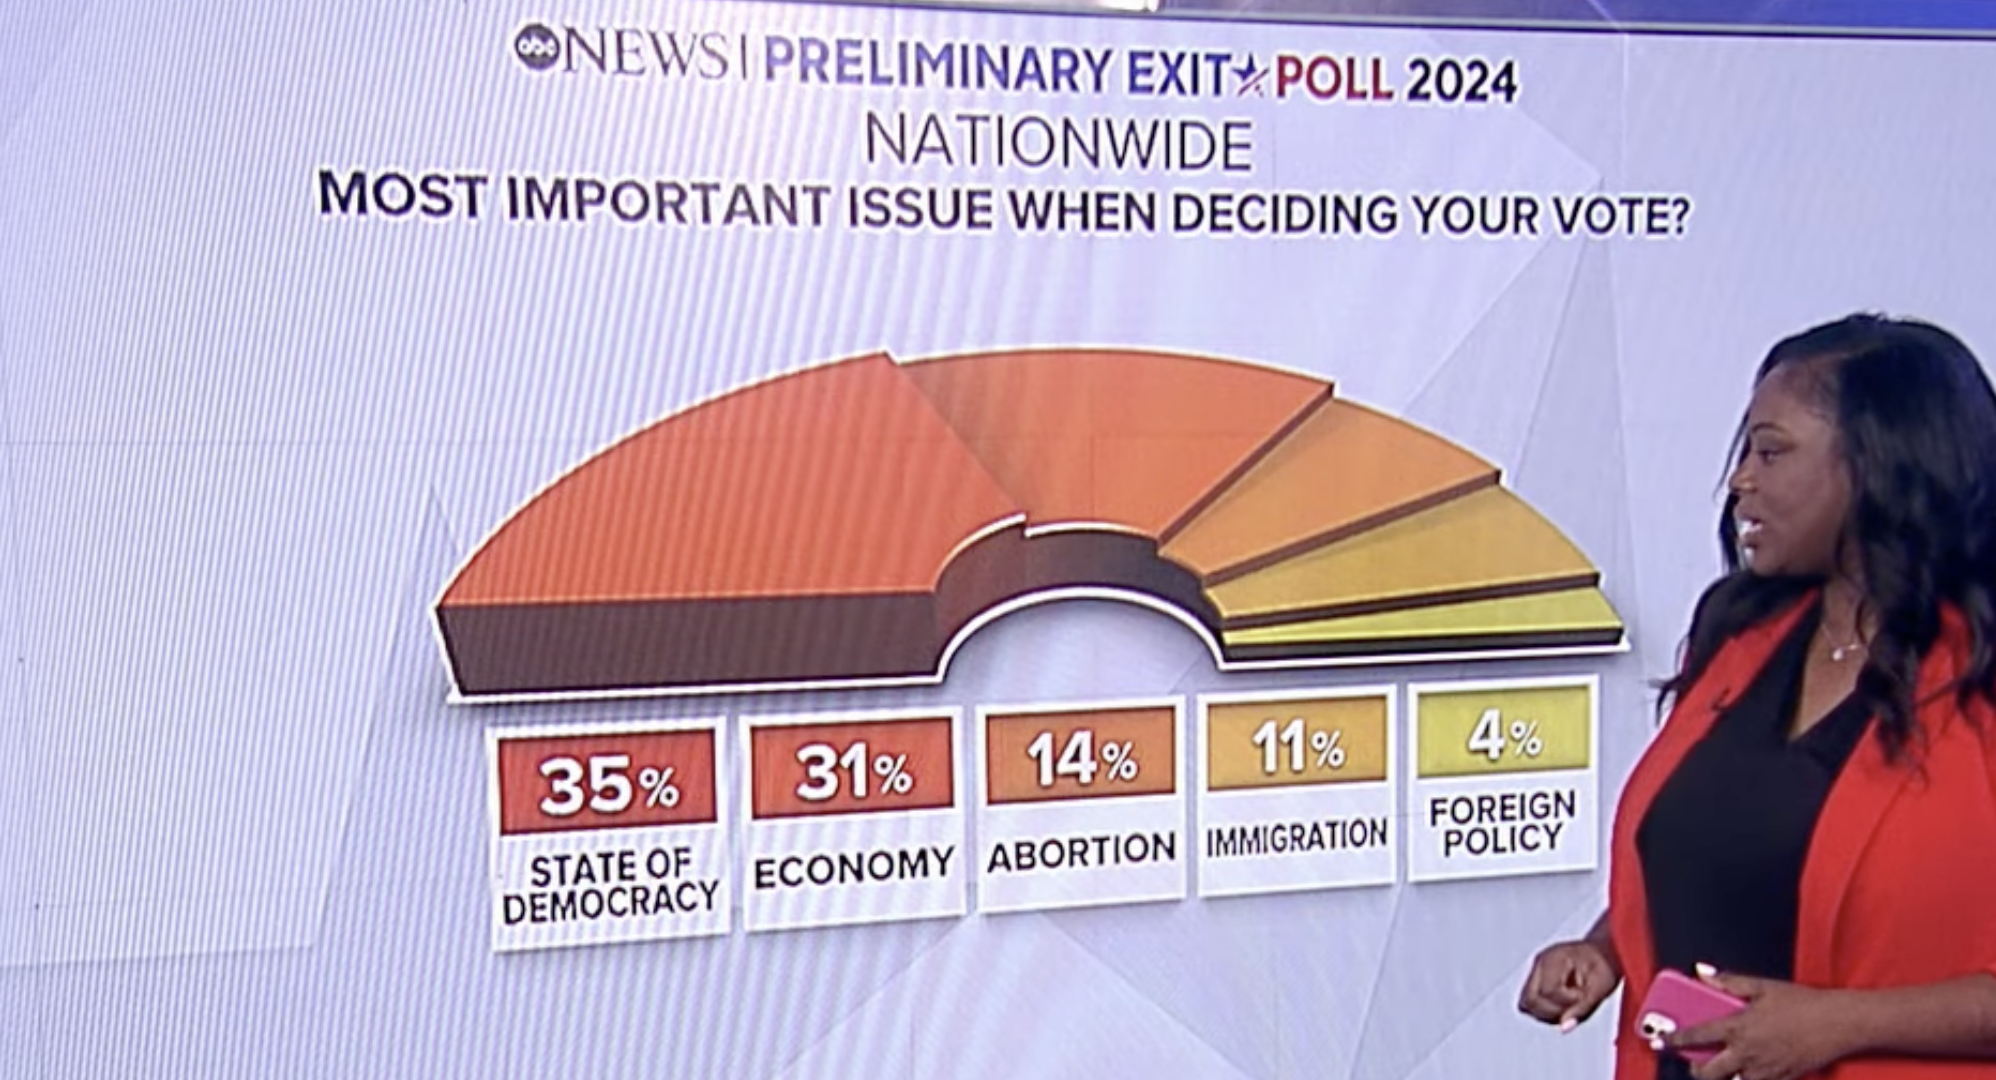

@vruz A graphic shows the results of a poll asking people what issue was most important to them when deciding their vote. The graphic is shaped like a pie chart, with the largest slice representing "State of Democracy" at 35%. The other slices represent "Economy" at 31%, "Abortion" at 14%, "Immigration" at 11%, and "Foreign Policy" at 4%. A woman in a red blazer is standing next to the graphic.

@vruz For a great President Harris!!!! Leader of the free world! The qualified candidate that is capable of thought and analysis. A great decision maker.

@vruz I am a single-issue voter for banning this kind of chart, whatever it is.
There's a block button and it's available for free Joel. There's no complaints office, however.