Recent searches
Search options
Administered by:

The European Ground Motion Service (EGMS) does not stop to amaze me (Disclaimer: I work at a company involved in its implementation).
It provides a very dense Pan-European point-wise mapping of surface displacement with millimeter accuracy. Measurements are based on Sentinel-1 time-series (Synthetic Aperture Radar Interferometry) and currently cover up to 6-day intervals from 2016 to 2020. Just browsing through the maps already reveals a variety of processes... some examples:
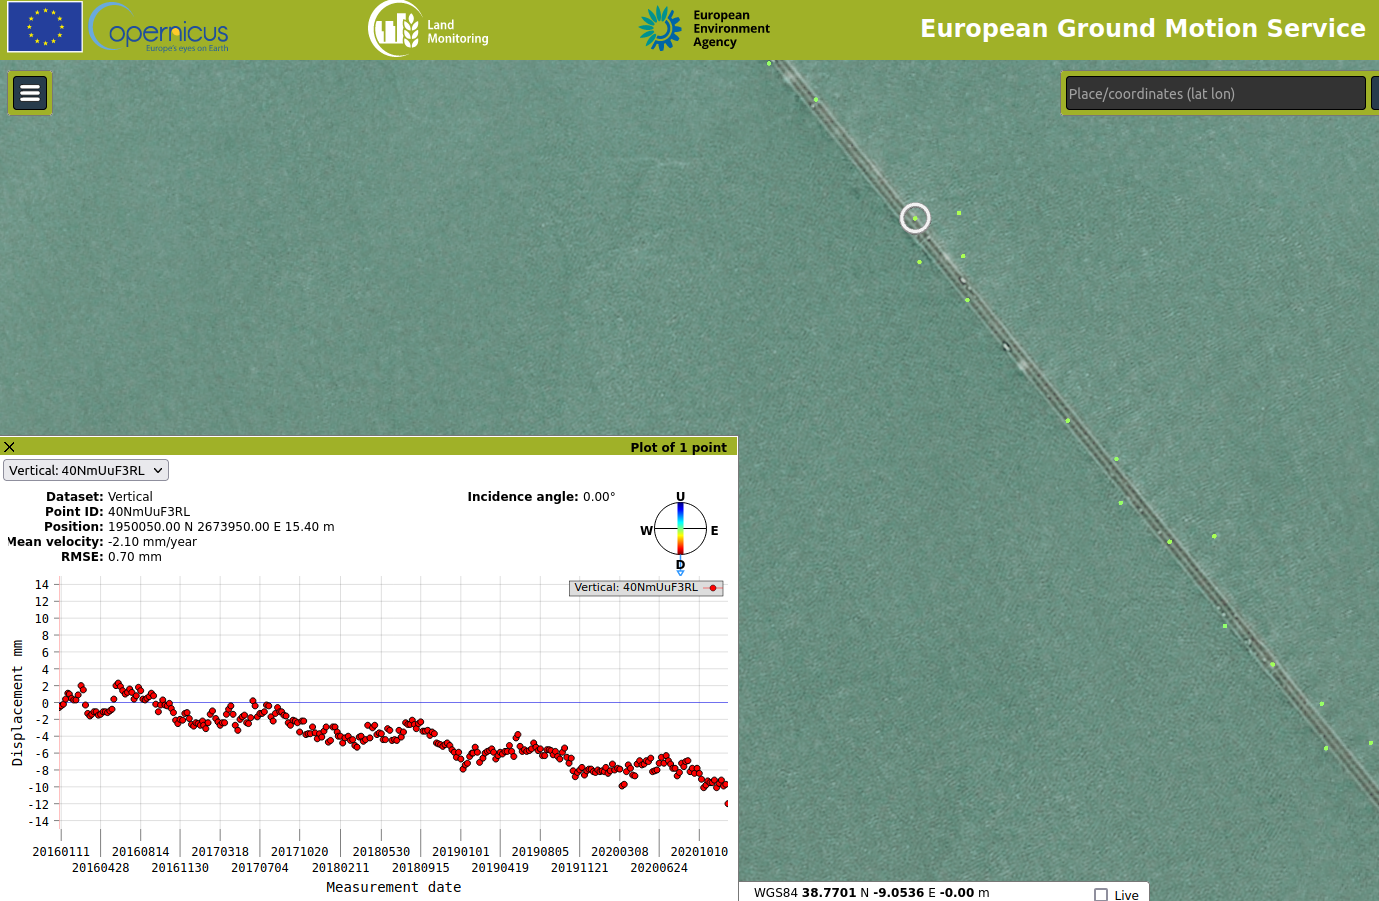
The first picture shows a slight subsidence and a seasonal pattern (thermal expansion) of the Vasco da Gama bridge (Portugal, longest bridge in Europe)
Subsidence of Emilia-Romagna coastland south of the Po River delta incl. Bologna (Italy), part of it can be attributed to self-compaction of the deposits from the Po river but the rate of subsidence has accelerated substantially due to groundwater extraction since the 1950s and 2cm/year are currently still common in the area:
https://egms.land.copernicus.eu/#llh=11.60596895,44.66405779,107962.65169867&look=-0.15418276,-0.69855265,-0.69875022&right=0.98768886,-0.09005354,-0.12791045&up=-0.02642725,0.70986939,-0.70383737&layers=VHR%20Image%20Mosaic%202012_VHR%20Image%20Mosaic%202012-Image-parent,L3-U-release-oct22
Uplift and subsidence of the Etna volcano (Italy), while the eastern flank continues to subside at a rate of 2cm/year the south-western flank raised in particular between early 2017 and early 2020 at similar rates:
https://egms.land.copernicus.eu/#llh=14.88765968,37.67454343,72920.97941970&look=-0.20478949,-0.61065099,-0.76496185&right=0.97878957,-0.12322685,-0.16366466&up=-0.00567815,0.78225348,-0.62293439&layers=VHR%20Image%20Mosaic%202012_VHR%20Image%20Mosaic%202012-Image-parent,L3-U-release-oct22

- Scandinavia is still recovering from the "depressing" 2km layer of ice that vanished at the end of the last ice age and keeps raising at rates between of 3-10mm/ year: https://egms.land.copernicus.eu/#llh=16.71829868,63.42785080,1207578.35819109&look=-0.12868020,-0.89437178,-0.42841630&right=0.98943957,-0.08672733,-0.11613659&up=-0.06671389,0.43883651,-0.89608692&layers=VHR%20Image%20Mosaic%202012_VHR%20Image%20Mosaic%202012-Image-parent,L3-U-release-oct22
These examples were already known and well studied before but having such precise and systematic measurements now available for everyone is still quite a leap.